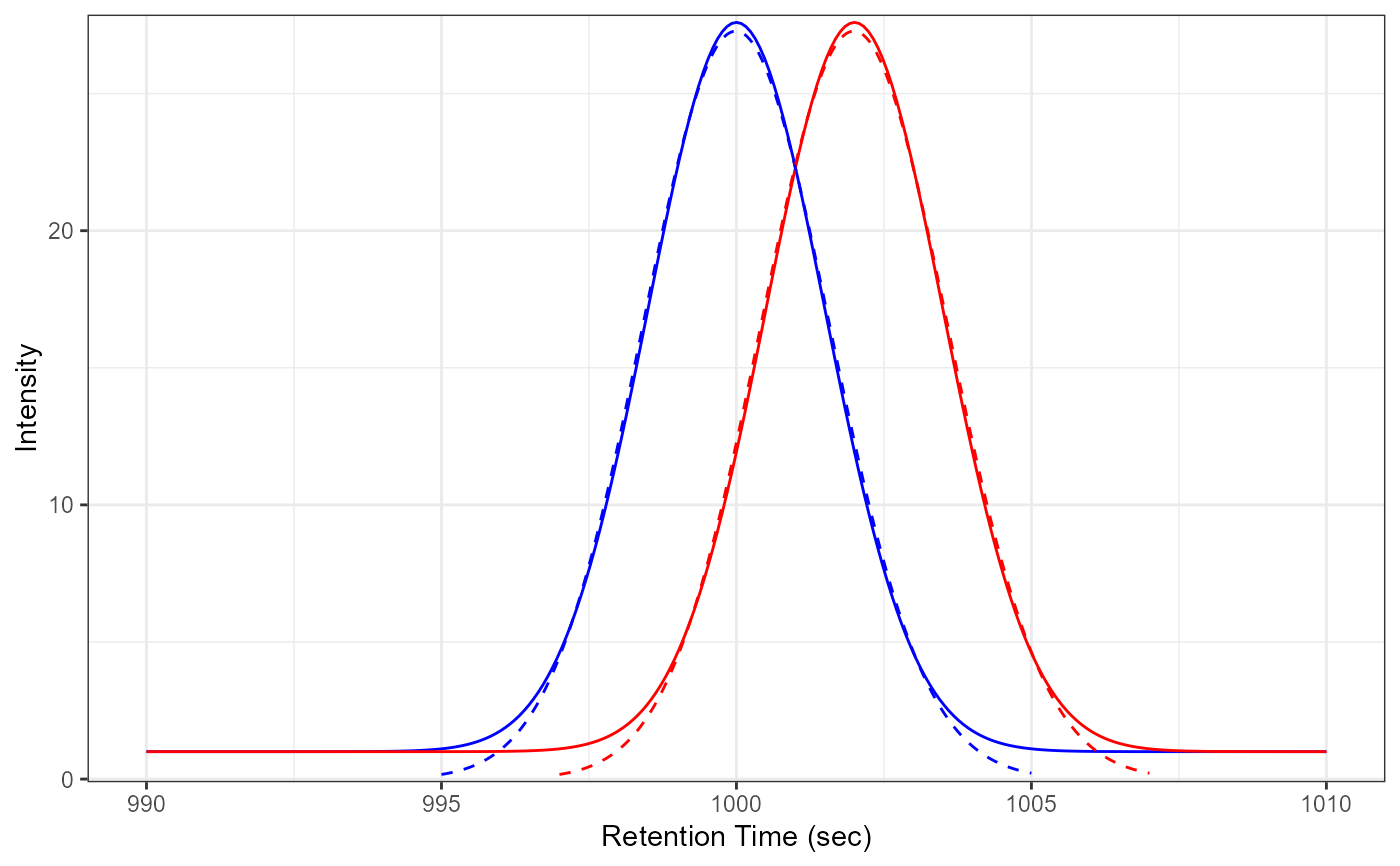
Plot samples raw data and detected feature for a single ROI
Source:R/peakPantheR_plotEICFit.R
peakPantheR_plotEICFit.Rdplot a ROI across multiple samples (x axis is RT, y axis is intensity). If curveFit is provided, the fitted curve for each sample is added.
peakPantheR_plotEICFit(
    ROIDataPointSampleList,
    curveFitSampleList = NULL,
    rtMin = NULL,
    rtMax = NULL,
    sampling = 250,
    sampleColour = NULL,
    verbose = TRUE
)
Arguments
- ROIDataPointSampleList
(list) list of
data.frameof raw data points for each sample (retention time 'rt', mass 'mz' and intensity 'int' (as column) of each raw data points (as row)).- curveFitSampleList
(list) NULL or a list of
peakPantheR_curveFit(or NA) for each sample- rtMin
(float) NULL or vector of detected peak minimum retention time (in sec)
- rtMax
(float) NULL or vector of detected peak maximum retention time (in sec)
- sampling
(int) Number of points to employ when plotting fittedCurve
- sampleColour
(str) NULL or vector colour for each sample (same length as
ROIDataPointSampleList,rtMin,rtMax)- verbose
(bool) if TRUE message when NA scans are removed
Value
Grob (ggplot object)
Examples
## Input data
# fake sample 1
# ROI data points
rt1             <- seq(990, 1010, by=20/250)
mz1             <- rep(522., length(rt1))
int1            <- (dnorm(rt1, mean=1000, sd=1.5) * 100) + 1
tmp_DataPoints1 <- data.frame(rt=rt1, mz=mz1, int=int1)
# fittedCurve
fit1        <- list(amplitude=37.068916502809756, center=999.3734222573454,
                    sigma=0.58493182568124724, gamma=0.090582029276037035,
                    fitStatus=2, curveModel='skewedGaussian')
class(fit1)     <- 'peakPantheR_curveFit'

# fake sample 2
# ROI data points
rt2             <- seq(990, 1010, by=20/250)
mz2             <- rep(522., length(rt2))
int2            <- (dnorm(rt2, mean=1002, sd=1.5) * 100) + 1
tmp_DataPoints2 <- data.frame(rt=rt2, mz=mz2, int=int2)
# fittedCurve
fit2        <- list(amplitude=37.073067416755556, center=1001.3736564832565,
                    sigma=0.58496485738212201, gamma=0.090553713725151905,
                    fitStatus=2, curveModel='skewedGaussian')
class(fit2)     <- 'peakPantheR_curveFit'

## Plot features in 1 sample without colours
peakPantheR_plotEICFit(ROIDataPointSampleList=list(tmp_DataPoints1),
                        curveFitSampleList=list(fit1),
                        rtMin=995., rtMax=1005.,
                        sampling=250, sampleColour=NULL, verbose=FALSE)


## Plot features in 2 samples with colours
peakPantheR_plotEICFit(
                ROIDataPointSampleList=list(tmp_DataPoints1,tmp_DataPoints2),
                curveFitSampleList=list(fit1, fit2),
                rtMin=c(995., 997.), rtMax=c(1005.,1007.),
                sampling=250, sampleColour=c('blue', 'red'), verbose=FALSE)
